Create A Data-Driven Content Marketing Campaign: A Guide

What Is Data-Driven Content?
Data-Driven content is a strategy used for content marketing campaigns.
This data is typically obtained from your brands buyer persona to create an effective marketing campaign.
Data-Driven content uses factual information generated from experiments (surveys or testing) to form conclusions.
Key takeaways:
- Know your audience: The content will not be effective if you don't write it with your audience in mind
- Leverage thought leaders and influencers: Understand what trends your audience is interested in
- Conduct keyword research: What are people searching for? How will you rank for these keywords?
- Review the metrics: Google Analytics is a great tool for reviewing existing and new content
Understanding Data-Driven Content
Creating a data-driven piece of content means that your stance on a particular subject is backed up by testing or data.
When you include data and numbers in your content, readers see your content as a trustworthy and valuable source. This could be in the form of:
- personal experiments
- well researched studies and test results (from trustworthy sources)
- data from media publications
According to Forbes, Companies who adopt data-driven marketing are 6x more likely to be profitable year-over-year.
But, data-driven content is not just about statistical significance - it's also about knowing your audience and building relationships.
If you have a clear understanding about who your audience is, what they believe in, and what their pain points are, then you have a unique advantage with this approach to content.
Real World Examples: Create A Data-Driven Content Marketing Campaign
Real World Examples: Data-Driven Content
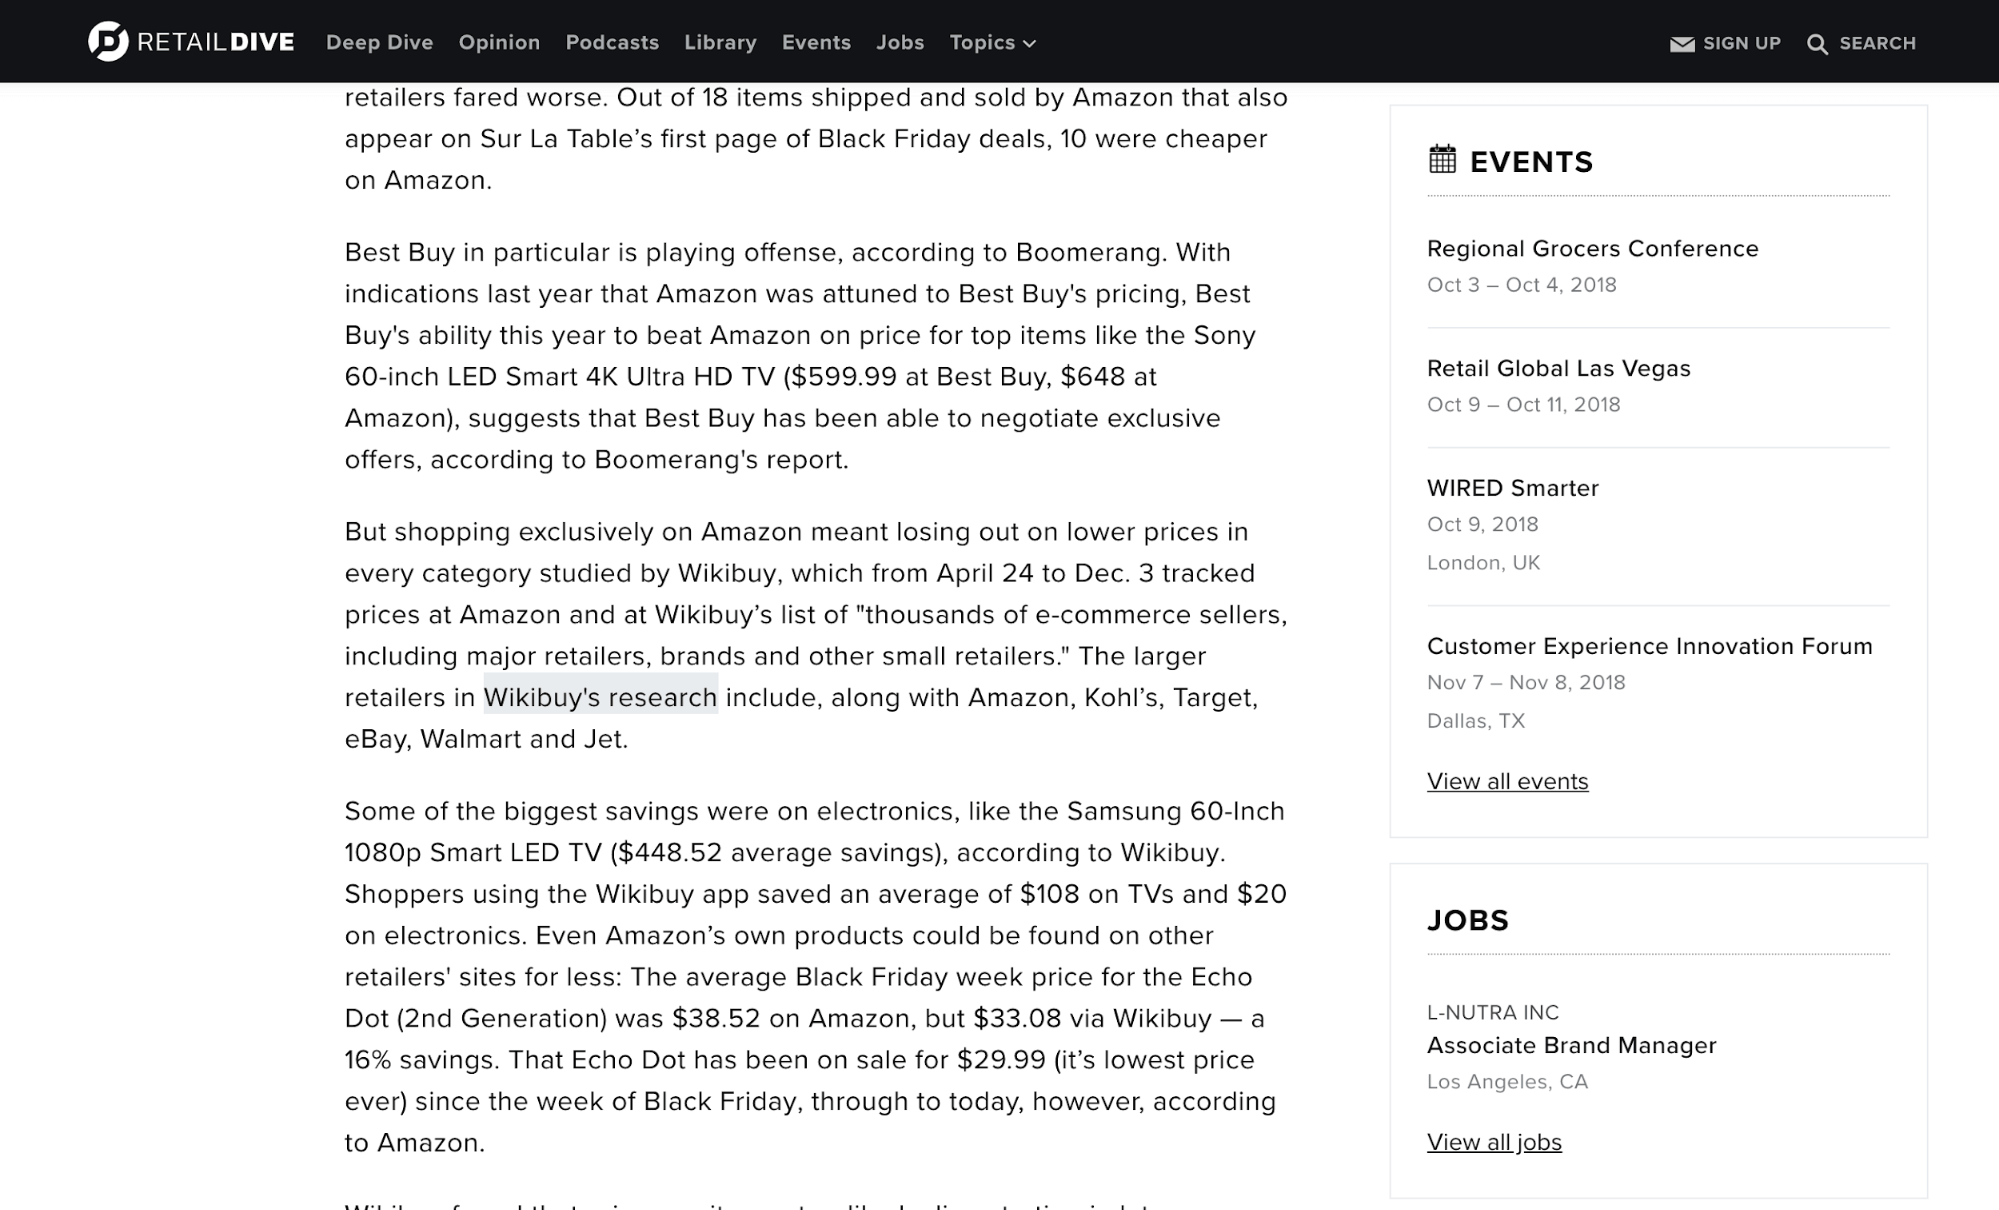
1. WikiBuy Black Friday Study
WikiBuy, the chrome extension that helps you find the lowest price online when shopping published a study during Black Friday. The study was around Amazon and customer purchases.
The data-driven graph showed that while customers did see big savings on Black Friday, they could have saved much more by shopping at other places.
WikiBuy created its own database of prices on Amazon compared to other websites that customers shopped at, showing a significant difference in price.
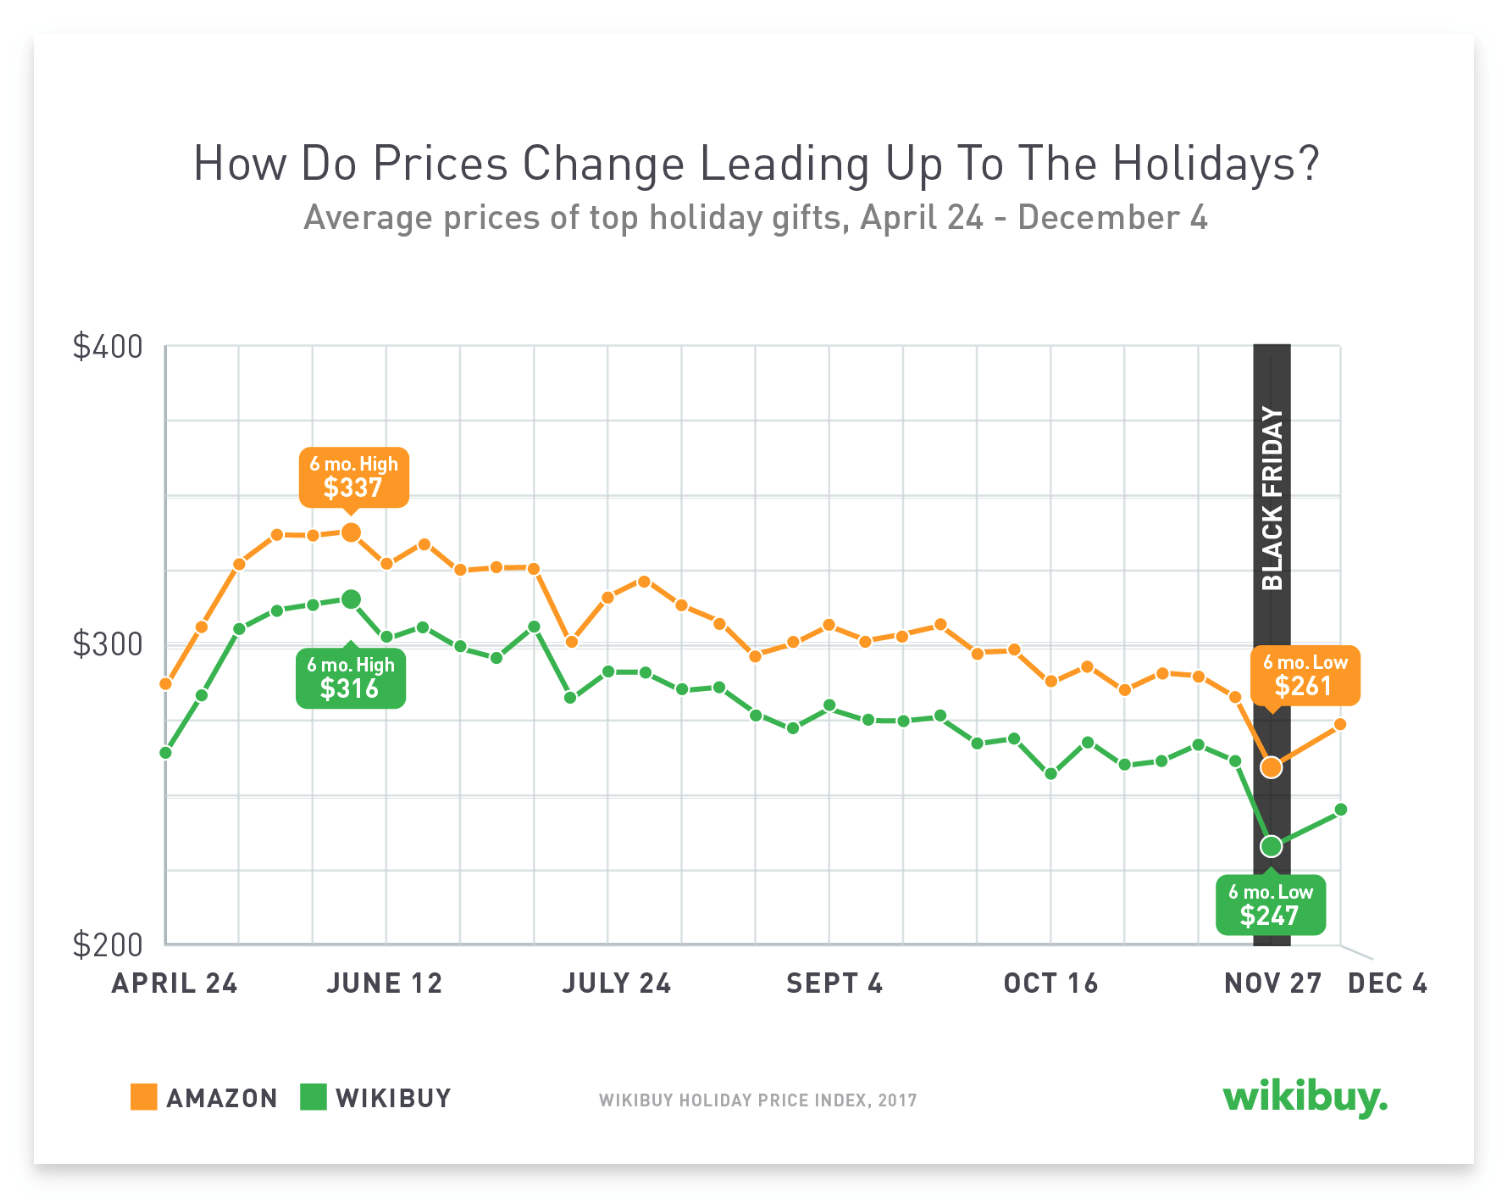
The company received quite a bit of backlinks and some pretty amazing press after publishing this study, which was a nice boost for them during the busy holiday season:
2. Hubspot Study: Plain Text vs HTML Emails: Which Is Better?
Hubspot published some of their own marketing test results and the outcome was surprising to most.
As it turns out, plain text emails actually outperformed HTML emails, despite a previous study conducted that said the opposite:
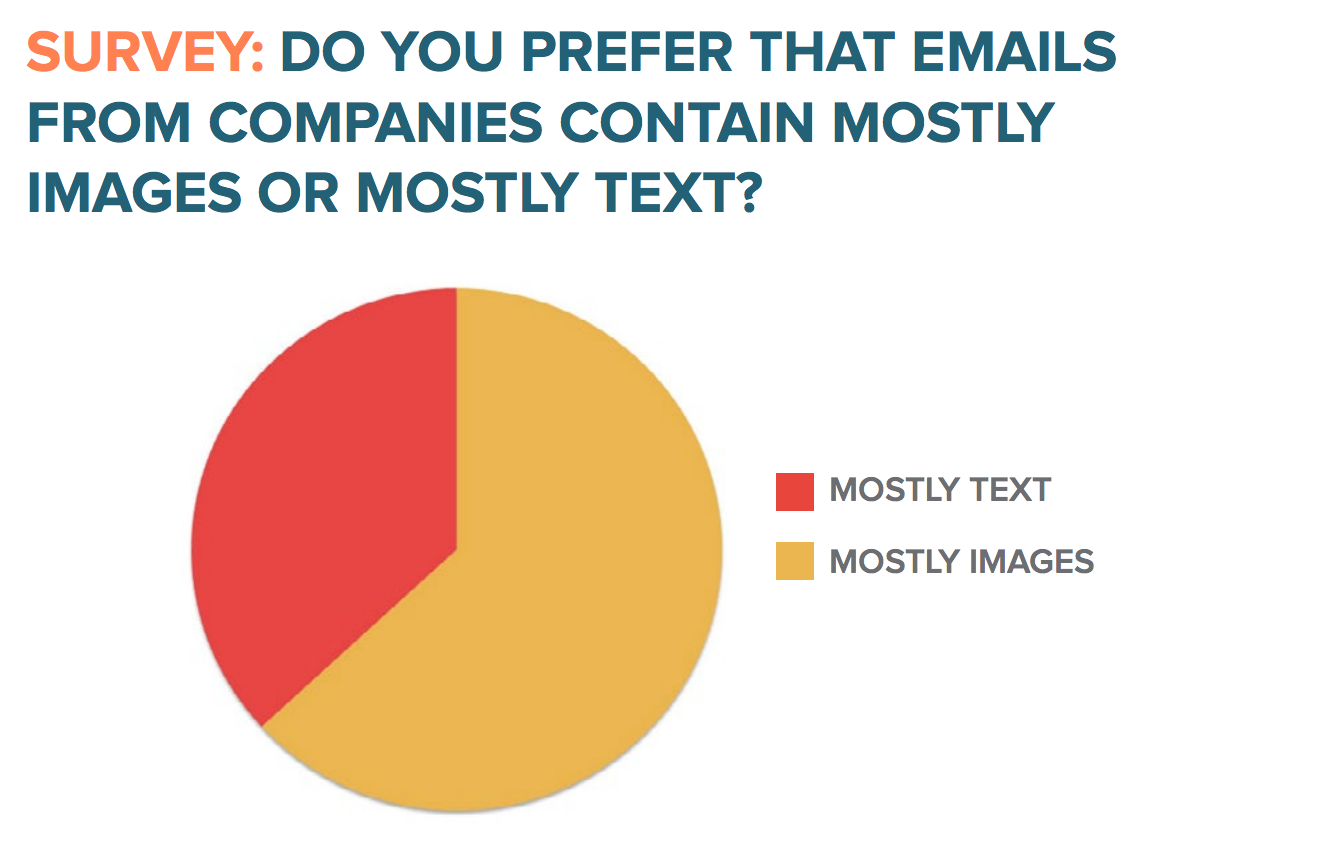
However, in every single A/B test conducted, the plain text email won with statistical significance. Surprise!
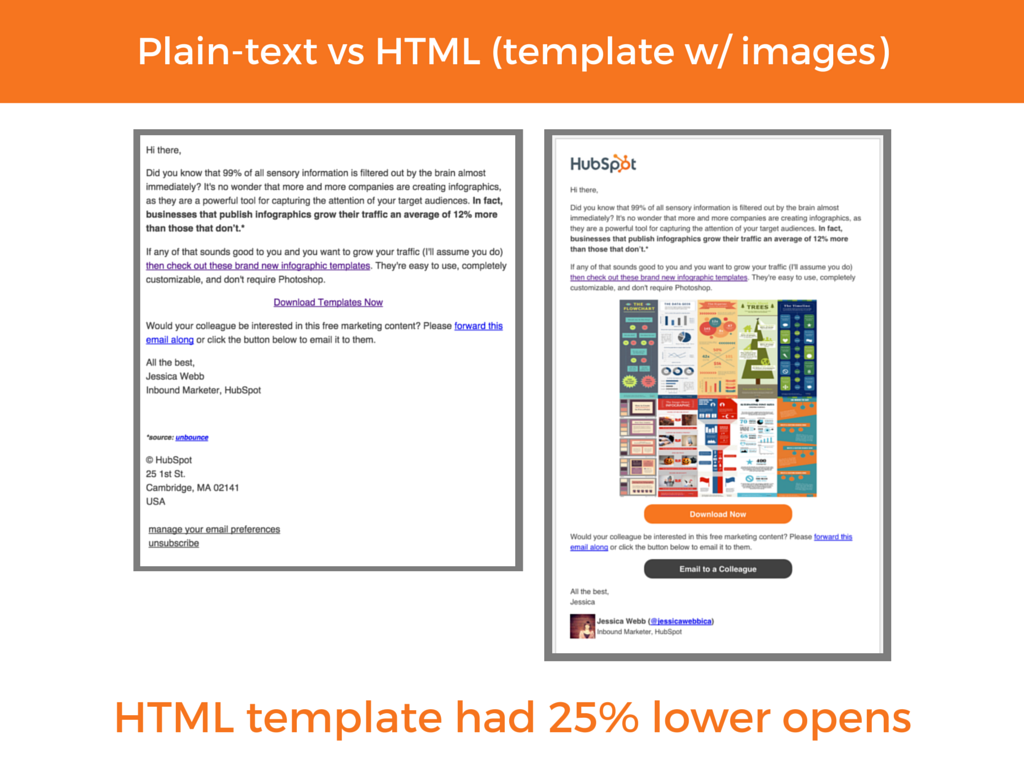
This study conducted is helpful, created specifically with the target audience in mind, and is a very useful study for other marketers to site in their own data-driven marketing campagins.
How To Get Started
Now that you have a good understanding of what it means to create effective data-driven content, it's time to get started!
Here's a few tips to consider:
- Research the right topic: Research keywords and trends to find what your audience is interested in. Research & write about something that is not as easily found on the internet and is not too general. You can do this by searching other competitors site and finding out what content is missing.
- Find the right data: Once you have found the right topic, it's important that you source accurate and relevant data. This should be in the form of stats and visuals such as charts, graphs, tables, etc.
- Create your article: It's important that you don't just compile all your stats together. Write an outline. Tell a compelling story that solves your customers problem.
- Title: Create a clickworthy title that shows the statistical approach to your article and share!
To learn more about creating a data-driven piece of content, check out this article
Real World Examples: Data-Driven Content
1. WikiBuy Black Friday Study
WikiBuy, the chrome extension that helps you find the lowest price online when shopping published a study during Black Friday. The study was around Amazon and customer purchases.
The data-driven graph showed that while customers did see big savings on Black Friday, they could have saved much more by shopping at other places.
WikiBuy created its own database of prices on Amazon compared to other websites that customers shopped at, showing a significant difference in price.
The company received quite a bit of backlinks and some pretty amazing press after publishing this study, which was a nice boost for them during the busy holiday season:
2. Hubspot Study: Plain Text vs HTML Emails: Which Is Better?
Hubspot published some of their own marketing test results and the outcome was surprising to most.
As it turns out, plain text emails actually outperformed HTML emails, despite a previous study conducted that said the opposite:
However, in every single A/B test conducted, the plain text email won with statistical significance. Surprise!
This study conducted is helpful, created specifically with the target audience in mind, and is a very useful study for other marketers to site in their own data-driven marketing campagins.
How To Get Started
Now that you have a good understanding of what it means to create effective data-driven content, it's time to get started!
Here's a few tips to consider:
- Research the right topic: Research keywords and trends to find what your audience is interested in. Research & write about something that is not as easily found on the internet and is not too general. You can do this by searching other competitors site and finding out what content is missing.
- Find the right data: Once you have found the right topic, it's important that you source accurate and relevant data. This should be in the form of stats and visuals such as charts, graphs, tables, etc.
- Create your article: It's important that you don't just compile all your stats together. Write an outline. Tell a compelling story that solves your customers problem.
- Title: Create a clickworthy title that shows the statistical approach to your article and share!
To learn more about creating a data-driven piece of content, check out this article

- 4,818 founder case studies
- Access to our founder directory
- Live events, courses and recordings
- 8,628 business ideas
- $1M in software savings
- 4,818 founder case studies
- Access to our founder directory
- Live events, courses and recordings
- 8,628 business ideas
- $1M in software savings
- 4,818 founder case studies
- Access to our founder directory
- Live events, courses and recordings
- 8,628 business ideas
- $1M in software savings
- 4,818 founder case studies
- Access to our founder directory
- Live events, courses and recordings
- 8,628 business ideas
- $1M in software savings
- 4,818 founder case studies
- Access to our founder directory
- Live events, courses and recordings
- 8,628 business ideas
- $1M in software savings
- 4,818 founder case studies
- Access to our founder directory
- Live events, courses and recordings
- 8,628 business ideas
- $1M in software savings
- 4,818 founder case studies
- Access to our founder directory
- Live events, courses and recordings
- 8,628 business ideas
- $1M in software savings
- 4,818 founder case studies
- Access to our founder directory
- Live events, courses and recordings
- 8,628 business ideas
- $1M in software savings